This site uses cookies to improve your experience. To help us insure we adhere to various privacy regulations, please select your country/region of residence. If you do not select a country, we will assume you are from the United States. Select your Cookie Settings or view our Privacy Policy and Terms of Use.
Cookie Settings
Cookies and similar technologies are used on this website for proper function of the website, for tracking performance analytics and for marketing purposes. We and some of our third-party providers may use cookie data for various purposes. Please review the cookie settings below and choose your preference.
Used for the proper function of the website
Used for monitoring website traffic and interactions
Cookie Settings
Cookies and similar technologies are used on this website for proper function of the website, for tracking performance analytics and for marketing purposes. We and some of our third-party providers may use cookie data for various purposes. Please review the cookie settings below and choose your preference.
Strictly Necessary: Used for the proper function of the website
Performance/Analytics: Used for monitoring website traffic and interactions
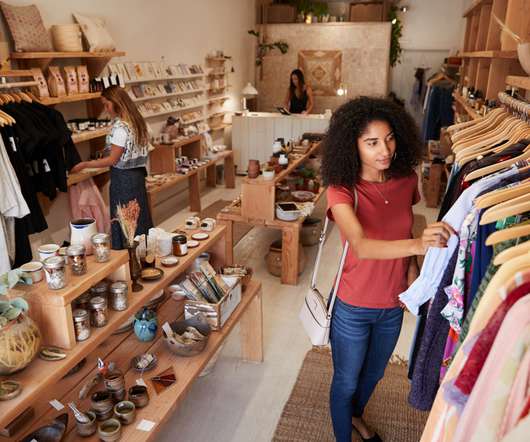
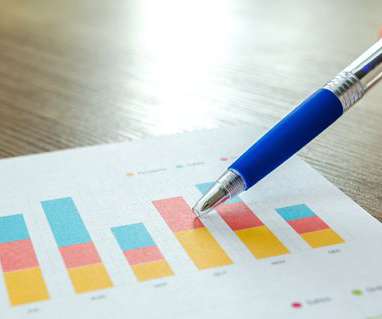
For instance, clothing and accessorystore sales were up 18.3% Results in other categories included: Sporting goods stores: Up 23.5% YoY; Furniture and home furnishings stores: Up 5.9% YoY; Building materials and garden supply stores: Up 12.1% YoY; Online and other non-store sales: Up 6% month-over-month, up 30.7%
Individual sales results from the retail sectors NRF examined for August include: Clothing and clothing accessorystores: Up 2.9% unadjusted year-over-year; Furniture and home furnishings stores : Up 2.1% unadjusted year-over-year; Electronics and appliance stores: Up 0.8%. month-over-month seasonally adjusted and up 0.4%
Since joining H&M in 2014, Li has worked her way through several different roles at the Swedish-born accessories and apparel brand, including merchandising, store development and e-commerce, to her job as head of customer activation and marketing for H&M Americas.
Some of the key findings in the NRF data include: Clothing and accessorystores were up 188%. unadjusted year-over-year; Online and other non-store sales were up 9%. unadjusted year-over-year; General merchandisestores were up 6%. unadjusted year-over-year; and Grocery and beverage stores were up 2%.
Founded in 1949 as Eileen Shoes , the company rebranded itself as Shoe City in 1980 and now sells urban-inspired footwear, apparel and accessories. Among Shoe City’s top creditors are New Balance , which the retailer owes nearly $1.6 million , and Timberland , owed $1.4 million in fiscal years 2020 and 2021, respectively.
JD Sports, which has been at Bullring since 2003, will open a new 27,500 sq ft store on the lower level. The new store will stock even more ranges from brands such as Nike, Adidas, Under Armour, and Converse, covering footwear, fashion, and accessories.
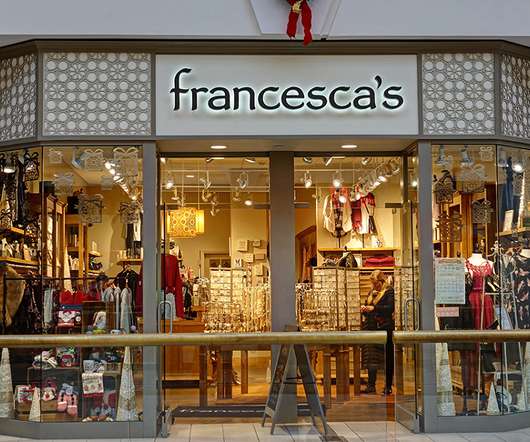
Following a 29% drop in net sales during Q2, apparel, jewelry and accessories retailer Francesca’s will investigate strategic alternatives ranging from lease deferrals and refinancing to bankruptcy. Francesca’s, which operates approximately 700.
Online and other non-store sales were down 1% month over month seasonally adjusted but up 8.5% Grocery and beverage stores were up 1.2% Clothing and clothing accessorystores were up 0.1% Health and personal care stores were down 0.2% Furniture and home furnishings stores were down 0.9%
June sales were up in five out of nine retail categories on a yearly basis, led by online sales, general merchandisestores and clothing and accessorystores. Specifics from key sectors include: Online and other non-store sales were up 1.78% month over month seasonally adjusted and up 23.08% year over year unadjusted.
September sales were up in five out of nine retail categories on a yearly basis, NRF said, led by health and personal care stores, online sales and general merchandisestores, and up or unchanged in all but three categories on a monthly basis. unadjusted year over year. • Online and other non-store sales were up 1.1%
April sales were up in four out of nine retail categories on a yearly basis, led by online sales, health and personal care stores and general merchandisestores, and also rose in four categories on a monthly basis. Specifics from key sectors include: Online and other non-store sales were up 1.2% unadjusted year over year.
January sales were up in six out of nine retail categories on a yearly basis, led by online sales, health and personal care stores and clothing and accessorystores, and up in five categories on a monthly basis. Health and personal care stores were up 0.51% month over month seasonally adjusted and up 9.7%
November-December holiday sales saw year-over-year gains across the board, led by increases at clothing, sporting goods and general merchandisestores. Specifics from key sectors for the two months combined, all on an unadjusted year-over-year basis, include: Clothing and clothing accessorystores, up 33.1
But also something not many people know is from this job, I had a sneaky passion and love for merchandisingstores! This is where I started to develop my passion for being customer-focused. I loved that part of my role and was a part of opening the very first Target in Tamworth NSW where I grew up!
November-December holiday sales saw year-over-year gains in all but two of nine retail categories, led by online sales, grocery stores and general merchandisestores. Specifics from key sectors for the two months combined, all on an unadjusted year-over-year basis, include: Online and other non-store sales were up 9.5%.
November-December holiday sales saw year-over-year gains across the board, led by increases at clothing, sporting goods and general merchandisestores. Specifics from key sectors for the two months combined, all on an unadjusted year-over-year basis, include: Clothing and clothing accessorystores, up 33.1%.
Specifics from key sectors for the two months combined, all on an unadjusted year-over-year basis, include: • Electronics and appliance stores were up 9.3%. Health and personal care stores were up 9%. Online and other non-store sales were up 8.2%. Clothing and clothing accessorystores were up 3%.
Health and personal care stores were up 0.03% month over month seasonally adjusted and up 4.5% Grocery and beverage stores were up 1.17% month over month and up 4.22% year over year unadjusted. General merchandisestores were up 0.13% month over month seasonally adjusted and up 3.38% year over year unadjusted.
Health and personal care stores were up 0.1% Electronics and appliance stores were up 1.1% General merchandisestores were down 0.1% Clothing and clothing accessorystores were up 0.6% Grocery and beverage stores were down 0.7% month over month adjusted and up 6.6% unadjusted. unadjusted. unadjusted.
Building materials and garden supply stores were up 2.2% General merchandisestores were up 0.4% Clothing and clothing accessorystores were unchanged month over month seasonally adjusted but down 0.2% Electronics and appliance stores were up 0.2% month over month seasonally adjusted and up 1.9%
Building and garden supply stores were up 4.39% month over month seasonally adjusted and up 4.41% year over year unadjusted. Clothing and accessoriesstores were up 0.46% month over month seasonally adjusted and up 2.08% year over year unadjusted.
Health and personal care stores were up 0.96% month over month seasonally adjusted and up 11.18% year over year unadjusted. Clothing and accessoriesstores were up 0.51% month over month and up 8.05% year over year unadjusted. Grocery and beverage stores were up 0.99% month over month and up 5.29% year over year unadjusted.
January sales were up in all but one retail category on a yearly basis, led by sporting goods stores, clothing stores and online sales, and increased across the board on a monthly basis. Specifics from key sectors include: Sporting goods stores were up 0.2% Clothing and clothing accessorystores were up 2.5%
Specifics from key sectors include: Grocery and beverage stores were up 1% month over month seasonally adjusted and up 7.9% Clothing and clothing accessorystores were up 2.6% Furniture and home furnishings stores were up 0.7% General merchandisestores were up 5.4% unadjusted year over year. year over year.
Sporting goods stores were up 0.2% General merchandisestores were down 3% month over month seasonally adjusted but up 2.9% Furniture and home furnishings stores were down 1.2% Clothing and clothing accessorystores were down 1.7% month over month seasonally adjusted and up 3.3% unadjusted year over year.
Sporting goods stores were down 0.6% General merchandisestores were down 0.1% Clothing and clothing accessorystores were down 0.2% Furniture and home furnishings stores were down 2.6% month over month seasonally adjusted but up 3.5% unadjusted year over year. month over month seasonally adjusted but up 3.2%
Health and personal care stores were up 0.4 Clothing and clothing accessorystores were down 0.6 General merchandisestores were down 0.7 percent month over month seasonally adjusted and up 1.5 percent unadjusted year over year. percent month over month seasonally adjusted but up 0.2
January sales were up in all but two categories on both a monthly and yearly basis, with year-over-year gains led by clothing and building materials stores and online sales. Specifics from key sectors include: Clothing and clothing accessorystores were up 0.7% Building materials and garden supply stores were up 4.1%
February sales were down in two-thirds of categories on a monthly basis but up across the board on a yearly basis, with year-over-year gains led by clothing and building materials stores and online sales. Specifics from key sectors include: Clothing and clothing accessorystores were up 1.1% Sporting goods stores were up 1.7%
May sales declined month-over-month in two-thirds of retail categories but were up year-over-year in every category except grocery stores, led by usually large increases at retailers like clothing, electronics and furniture stores that were ordered to close last spring. Electronics and appliance stores were down 3.4%
I feel like what a modern business looks like isn’t so much a clothing brand that does videos to promote itself, but a video channel with a merchandisestore. The future of the business requires me to make more videos, as much as humanly possible. That’s realistically what it is.
Sporting goods stores were up 0.5 Clothing and clothing accessorystores were up 0.4 Health and personal care stores were down 0.6 General merchandisestores were up 0.5 percent month over month seasonally adjusted and up 7.1 percent unadjusted year over year. percent unadjusted year over year.
November sales were up in all but three categories on a monthly basis and were up across the board year-over-year, led by increases at clothing, sporting goods and furniture stores. Specifics from key sectors include: Clothing and clothing accessorystores were up 0.5% Sporting goods stores were up 1.3%
October sales were up in all but two categories on a monthly basis and were up across the board year-over-year, led by increases at clothing, electronics and sporting goods stores. Specifics from key sectors include: Clothing and clothing accessorystores were down 0.7% Electronics and appliance stores were up 3.8%
June sales were up year-over-year across the board, led by increases at clothing, electronics and furniture stores. Specifics from key retail sectors include: Clothing and clothing accessorystores were up 2.6% Electronics and appliance stores were up 3.3% Online and other non-store sales were up 1.2%
Despite month-over-month declines in two-thirds of retail categories, April retail sales increased across the board on a year-over-year basis, led by massive increases in retailers like clothing, furniture and sporting goods stores that were ordered to close last spring. Furniture and home furnishings stores were down 0.7%
Grocery stores – the only category to show a year-over-year decline – were among the few retailers allowed to remain open. Specifics from key retail sectors include: Clothing and clothing accessorystores were up 18.3% Sporting goods stores were up 23.5% Electronics and appliance stores were up 10.5%
We organize all of the trending information in your field so you don't have to. Join 40,000+ users and stay up to date on the latest articles your peers are reading.
You know about us, now we want to get to know you!
Let's personalize your content
Let's get even more personalized
We recognize your account from another site in our network, please click 'Send Email' below to continue with verifying your account and setting a password.


Let's personalize your content