This site uses cookies to improve your experience. To help us insure we adhere to various privacy regulations, please select your country/region of residence. If you do not select a country, we will assume you are from the United States. Select your Cookie Settings or view our Privacy Policy and Terms of Use.
Cookie Settings
Cookies and similar technologies are used on this website for proper function of the website, for tracking performance analytics and for marketing purposes. We and some of our third-party providers may use cookie data for various purposes. Please review the cookie settings below and choose your preference.
Used for the proper function of the website
Used for monitoring website traffic and interactions
Cookie Settings
Cookies and similar technologies are used on this website for proper function of the website, for tracking performance analytics and for marketing purposes. We and some of our third-party providers may use cookie data for various purposes. Please review the cookie settings below and choose your preference.
Strictly Necessary: Used for the proper function of the website
Performance/Analytics: Used for monitoring website traffic and interactions
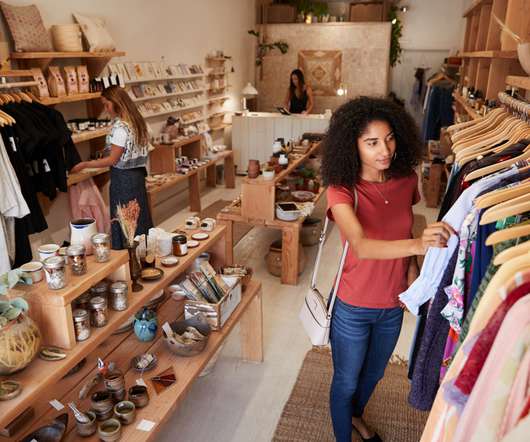
If you want tennis balls, you can wait for them to be delivered or you can go to a big-box sportinggoodsstore, but if you’re on the way to the courts shouldn’t you be able to go somewhere really convenient along the way? It’s almost like the old general store that is the core of what we offer.
For instance, clothing and accessory store sales were up 18.3% Results in other categories included: Sportinggoodsstores: Up 23.5% YoY; Furniture and home furnishings stores: Up 5.9% YoY; Building materials and garden supply stores: Up 12.1% YoY; Electronics and appliance stores: Up 10.5%
Individual sales results from the retail sectors NRF examined for August include: Clothing and clothing accessory stores: Up 2.9% unadjusted year-over-year; Furniture and home furnishings stores : Up 2.1% unadjusted year-over-year; Building materials and garden supply stores: Up 2% month-over-month seasonally adjusted and up 11.9%.
Furniture and home furnishings stores were down 0.9% Sportinggoodsstores were up 0.4% General merchandisestores were up 0.1% Electronics and appliance stores were down 1.3% month over month seasonally adjusted but up 2.3% unadjusted year over year. month over month seasonally adjusted and up 1.2%
November-December holiday sales saw year-over-year gains across the board, led by increases at clothing, sportinggoods and general merchandisestores. Specifics from key sectors for the two months combined, all on an unadjusted year-over-year basis, include: Clothing and clothing accessory stores, up 33.1
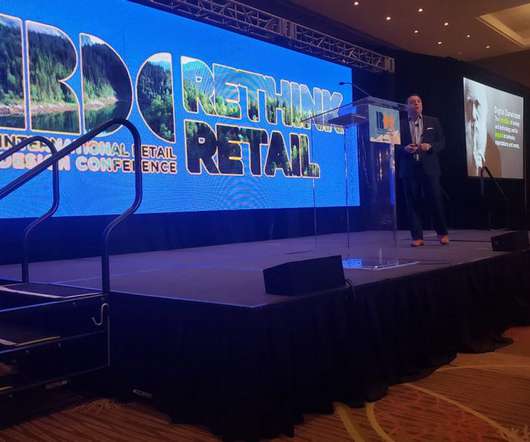
DENVER — The 21st annual International Retail Design Conference presented by VMSD magazine kicked off on Tuesday, welcoming a throng of visual merchandisers, store designers and retail executives to the Sheraton Denver Downtown Hotel for the two-day conference.
June sales were up in five out of nine retail categories on a yearly basis, led by online sales, general merchandisestores and clothing and accessory stores. Specifics from key sectors include: Online and other non-store sales were up 1.78% month over month seasonally adjusted and up 23.08% year over year unadjusted.
November-December holiday sales saw year-over-year gains across the board, led by increases at clothing, sportinggoods and general merchandisestores. Specifics from key sectors for the two months combined, all on an unadjusted year-over-year basis, include: Clothing and clothing accessory stores, up 33.1%.
March sales were up in six out of nine retail categories on a yearly basis, led by online sales, sportinggoodsstores and health and personal care stores, and up in five categories on a monthly basis. Health and personal care stores were up 0.03% month over month seasonally adjusted and up 4.5%
February sales were up in all but one of nine retail categories on a yearly basis, led by online sales, sportinggoodsstores and health and personal care stores, and up across the board on a monthly basis. Specifics from key sectors include: Online and other non-store sales were up 0.8%
January sales were up in all but one retail category on a yearly basis, led by sportinggoodsstores, clothing stores and online sales, and increased across the board on a monthly basis. Specifics from key sectors include: Sportinggoodsstores were up 0.2% Health and personal care stores were up 1.9%
September sales were up in five out of nine retail categories on a yearly basis, NRF said, led by health and personal care stores, online sales and general merchandisestores, and up or unchanged in all but three categories on a monthly basis. unadjusted year over year. • Online and other non-store sales were up 1.1%
April sales were up in four out of nine retail categories on a yearly basis, led by online sales, health and personal care stores and general merchandisestores, and also rose in four categories on a monthly basis. Specifics from key sectors include: Online and other non-store sales were up 1.2% unadjusted year over year.
November-December holiday sales saw year-over-year gains in all but two of nine retail categories, led by online sales, grocery stores and general merchandisestores. Specifics from key sectors for the two months combined, all on an unadjusted year-over-year basis, include: Online and other non-store sales were up 9.5%.
Grocery and beverage stores were down 0.2% Sportinggoods, hobby, music and book stores were down 0.65% month over month seasonally adjusted but up 1.79% year over year unadjusted. General merchandisestores were down 0.64% month over month seasonally adjusted but up 1.14% year over year unadjusted.
. • Health and personal care stores were up 9%. Online and other non-store sales were up 8.2%. Clothing and clothing accessory stores were up 3%. General merchandisestores were up 2%. Grocery and beverage stores were up 1.1%. Sportinggoodsstores were up 0.3%.
Electronics and appliance stores were up 1.1% General merchandisestores were down 0.1% Clothing and clothing accessory stores were up 0.6% Grocery and beverage stores were down 0.7% Sportinggoodsstores were down 1% month over month adjusted and down 0.9% month over month adjusted and up 1.8%
Grocery and beverage stores were up 0.3% Sportinggoodsstores were up 0.3% Building materials and garden supply stores were up 2.2% General merchandisestores were up 0.4% month over month seasonally adjusted and up 3.7% unadjusted year over year. month over month seasonally adjusted and up 2.5%
Clothing and accessories stores were up 0.46% month over month seasonally adjusted and up 2.08% year over year unadjusted. General merchandisestores were up 0.26% month over month seasonally adjusted and up 0.69% year over year unadjusted.
Clothing and clothing accessory stores were up 2.6% Furniture and home furnishings stores were up 0.7% General merchandisestores were up 5.4% Building materials and garden supply stores were up 0.5% Building materials and garden supply stores were up 0.5% Health and personal care stores were down 0.3%
Grocery and beverage stores were down 0.1% Sportinggoodsstores were up 0.2% General merchandisestores were down 3% month over month seasonally adjusted but up 2.9% Furniture and home furnishings stores were down 1.2% month over month seasonally adjusted but up 5.6% unadjusted year over year.
Building materials and garden supply stores were down 2.5% Sportinggoodsstores were down 0.6% General merchandisestores were down 0.1% Clothing and clothing accessory stores were down 0.2% month over month seasonally adjusted but up 3.7% unadjusted year over year. unadjusted year over year.
Building materials and garden supply stores were up 1.5 Grocery and beverage stores were up 0.2 Sportinggoodsstores were up 0.1 Health and personal care stores were up 0.4 Health and personal care stores were up 0.4 Clothing and clothing accessory stores were down 0.6
Grocery and beverage stores were up 1.1% General merchandisestores were up 3.6% Furniture and home furnishings stores were up 7.2% Sportinggoodsstores were down 3% month-over-month seasonally adjusted and down 0.8% month-over-month seasonally adjusted and up 7.2% unadjusted year-over-year.
Online and other non-store sales were down 3.7% General merchandisestores were down 0.2% Sportinggoodsstores were up 1.7% Health and personal care stores were down 1.8% month-over-month seasonally adjusted but up 13.9% unadjusted year-over-year. month-over-month seasonally adjusted but up 12.6%
Electronics and appliance stores were down 3.4% Furniture and home furnishings stores were down 2.1% Sportinggoodsstores were down 0.8% Health and personal care stores were up 1.8% Health and personal care stores were up 1.8% Building materials and garden supply stores were down 5.9%
Isn’t that much different than the the bigger store formats we’ve already seen Amazon starting to experiment with so I guess I’m just saying. Even though they generally got a covid boost so. That that is pretty interesting and then the thing that I most look at specifically related to covid is.
Online and other non-store sales were down 0.7 Grocery and beverage stores were up 0.5 Sportinggoodsstores were up 0.5 Clothing and clothing accessory stores were up 0.4 Clothing and clothing accessory stores were up 0.4 Health and personal care stores were down 0.6
November sales were up in all but three categories on a monthly basis and were up across the board year-over-year, led by increases at clothing, sportinggoods and furniture stores. Specifics from key sectors include: Clothing and clothing accessory stores were up 0.5% Sportinggoodsstores were up 1.3%
October sales were up in all but two categories on a monthly basis and were up across the board year-over-year, led by increases at clothing, electronics and sportinggoodsstores. Specifics from key sectors include: Clothing and clothing accessory stores were down 0.7% Electronics and appliance stores were up 3.8%
Despite month-over-month declines in two-thirds of retail categories, April retail sales increased across the board on a year-over-year basis, led by massive increases in retailers like clothing, furniture and sportinggoodsstores that were ordered to close last spring. Furniture and home furnishings stores were down 0.7%
Online and other non-store sales were up 1.2% Sportinggoodsstores were down 1.7% General merchandisestores were up 1.9% Building materials and garden supply stores were down 1.6% month-over-month seasonally adjusted and up 12% unadjusted year-over-year. unadjusted year-over-year.
Specifics from key retail sectors include: Clothing and clothing accessory stores were up 18.3% Sportinggoodsstores were up 23.5% Furniture and home furnishings stores were up 5.9 Electronics and appliance stores were up 10.5% Health and personal care stores were up 5.7% unadjusted year-over-year.
We organize all of the trending information in your field so you don't have to. Join 40,000+ users and stay up to date on the latest articles your peers are reading.
You know about us, now we want to get to know you!
Let's personalize your content
Let's get even more personalized
We recognize your account from another site in our network, please click 'Send Email' below to continue with verifying your account and setting a password.


Let's personalize your content