This site uses cookies to improve your experience. To help us insure we adhere to various privacy regulations, please select your country/region of residence. If you do not select a country, we will assume you are from the United States. Select your Cookie Settings or view our Privacy Policy and Terms of Use.
Cookie Settings
Cookies and similar technologies are used on this website for proper function of the website, for tracking performance analytics and for marketing purposes. We and some of our third-party providers may use cookie data for various purposes. Please review the cookie settings below and choose your preference.
Used for the proper function of the website
Used for monitoring website traffic and interactions
Cookie Settings
Cookies and similar technologies are used on this website for proper function of the website, for tracking performance analytics and for marketing purposes. We and some of our third-party providers may use cookie data for various purposes. Please review the cookie settings below and choose your preference.
Strictly Necessary: Used for the proper function of the website
Performance/Analytics: Used for monitoring website traffic and interactions
The 2024 figures were driven in part by lower inflation compared with 2023, particularly for goods. Ecommerce, HomeFurnishings Show Strong Growth Online and other non-store sales grew 8.6% Several product categories also registered increases on an unadjusted year-over-year basis including: Furniture and homefurnishings: up 5.6%
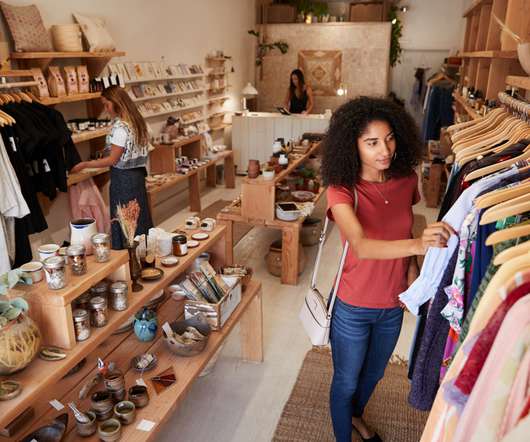
Example of Store Category of Retailers Craft Shops Arts & Crafts Furniture Stores HomeFurnishingsSportingGoods Retailers Sports Equipment Pet Supply Stores Animal Care Department Stores Department stores serve as an extensive shopping destination for consumers, offering a vast array of products under one roof.
Results in other categories included: Sportinggoods stores: Up 23.5% YoY; Furniture and homefurnishings stores: Up 5.9% For instance, clothing and accessory store sales were up 18.3% month-over-month seasonally adjusted, and up 104.6% unadjusted YoY. month-over-month, up 78.2% month-over-month, up 49.6%
unadjusted year-over-year; Furniture and homefurnishings stores : Up 2.1% unadjusted year-over-year; and Sportinggoods stores: Down 5.7%. unadjusted year-over-year; Furniture and homefurnishings stores : Up 2.1% unadjusted year-over-year; and Sportinggoods stores: Down 5.7%.
Furniture and homefurnishings stores were down 0.9% Sportinggoods stores were up 0.4% Health and personal care stores were down 0.2% month over month seasonally adjusted but up 5.8% unadjusted year over year. month over month seasonally adjusted but up 2.3% unadjusted year over year. unadjusted year over year.
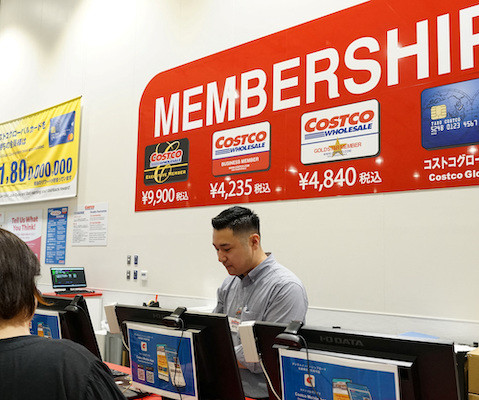
Gold and jewelry topped the list of best-selling items, followed by hardware, gift cards, homefurnishings, health and beauty, and sportinggoods. (The Costco app was downloaded 2.9 million times during the quarter.) No bias toward international The company added six new warehouses and relocated one in the first quarter.
Vincom is easily the largest mall developer and operator in Vietnam, and wants to focus less on new development this year and more on a trifecta of objectives aimed at its existing mall fleet: driving rental growth, upgrading its market positioning, and strengthening the shaky operating metrics of elements of its far-flung portfolio.
March sales were up in six out of nine retail categories on a yearly basis, led by online sales, sportinggoods stores and health and personal care stores, and up in five categories on a monthly basis. Sportinggoods, hobby, music and book stores were up 0.86% month over month seasonally adjusted and up 8.33% year over year unadjusted.
February sales were up in all but one of nine retail categories on a yearly basis, led by online sales, sportinggoods stores and health and personal care stores, and up across the board on a monthly basis. Furniture and homefurnishings stores were up 0.45% month over month seasonally adjusted but down 1.56% year over year unadjusted.
January sales were up in all but one retail category on a yearly basis, led by sportinggoods stores, clothing stores and online sales, and increased across the board on a monthly basis. Specifics from key sectors include: Sportinggoods stores were up 0.2% Furniture and homefurnishings stores were up 4.4%
November-December holiday sales saw year-over-year gains across the board, led by increases at clothing, sportinggoods and general merchandise stores. Sportinggoods stores, up 20.9 Furniture and homefurnishings stores, up 15 percent. General merchandise stores, up 15.2
November-December holiday sales saw year-over-year gains across the board, led by increases at clothing, sportinggoods and general merchandise stores. Sportinggoods stores, up 20.9%. Furniture and homefurnishings stores, up 15%. General merchandise stores, up 15.2%.
Sportinggoods, hobby, music and book stores were down 0.65% month over month seasonally adjusted but up 1.79% year over year unadjusted. Furniture and homefurnishings stores were down 0.97% month over month seasonally adjusted and down 6.35% year over year unadjusted. year over year unadjusted.
Sportinggoods stores were up 0.3%. Furniture and homefurnishings stores were down 6.2%. . • Clothing and clothing accessory stores were up 3%. General merchandise stores were up 2%. Grocery and beverage stores were up 1.1%. Building materials and garden supply stores were down 3.9%.
unadjusted year over year. • Sportinggoods stores were unchanged month over month seasonally adjusted but down 1.6% unadjusted year over year. • Furniture and homefurnishings stores were unchanged month over month seasonally adjusted but down 6.5% . • Clothing and clothing accessory stores were down 0.8%
Furniture and homefurnishings stores were down 0.7% Sportinggoods stores were down 3.3% Electronics and appliance stores were down 0.5% month over month seasonally adjusted and down 8.2% unadjusted year over year. month over month seasonally adjusted and down 8.8% unadjusted year over year. unadjusted year over year.
Several product categories have already reached that level, including toy and hobby, office supply, consumer electronics, books and magazines, music and videos, computer hardware and software, homefurnishings, and sportinggoods. “E-commerce E-commerce in the U.S.
Sportinggoods, hobby, music and book stores were up 0.68% month over month seasonally adjusted but down 0.52% year over year unadjusted. Furniture and homefurnishings stores were down 0.62% month over month seasonally adjusted and down 3.26% year over year unadjusted.
Sportinggoods stores were down 1% month over month adjusted and down 0.9% Furniture and homefurnishings stores were up 1.4% Clothing and clothing accessory stores were up 0.6% month over month adjusted and up 1.3% unadjusted. Grocery and beverage stores were down 0.7% month over month adjusted but up 1.3% unadjusted.
Sportinggoods stores were up 0.3% Furniture and homefurnishings stores were up 0.4% Online and other non-store sales were up 0.3% month over month seasonally adjusted and up 8.7% unadjusted year over year. Grocery and beverage stores were up 0.3% month over month seasonally adjusted and up 3.7%
Sportinggoods, hobby, music and book stores were up 0.26% month over month seasonally adjusted but down 0.38% year over year unadjusted. Furniture and homefurnishings stores were up 1.67% month over month seasonally adjusted but down 3.28% year over year unadjusted.
Furniture and homefurnishings stores were up 0.7% Sportinggoods stores were up 3.3% Specifics from key sectors include: Grocery and beverage stores were up 1% month over month seasonally adjusted and up 7.9% unadjusted year over year. Clothing and clothing accessory stores were up 2.6% unadjusted year over year.
Sportinggoods stores were up 0.2% Furniture and homefurnishings stores were down 1.2% Grocery and beverage stores were down 0.1% month over month seasonally adjusted but up 5.6% unadjusted year over year. month over month seasonally adjusted and up 3.3% unadjusted year over year. unadjusted year over year.
Sportinggoods stores were down 0.6% Furniture and homefurnishings stores were down 2.6% Health and personal care stores were up 0.7% month over month seasonally adjusted and up 4.3% unadjusted year over year. Building materials and garden supply stores were down 2.5% month over month seasonally adjusted but up 3.7%
Sportinggoods stores were up 0.1 Furniture and homefurnishings stores were up 0.2 Building materials and garden supply stores were up 1.5 percent month over month seasonally adjusted and up 6.2 percent unadjusted year over year. Grocery and beverage stores were up 0.2 percent unadjusted year over year.
Furniture and homefurnishings stores were up 7.2% Sportinggoods stores were down 3% month-over-month seasonally adjusted and down 0.8% General merchandise stores were up 3.6% month-over-month seasonally adjusted and up 6.4% unadjusted year-over-year. month-over-month seasonally adjusted and up 1.5%
Sportinggoods stores were up 3.5%. Furniture and homefurnishings stores were down 1.1%. Grocery and beverage stores were up 7.8%. General merchandise stores were up 3.8%. Health and personal care stores were up 2.8%. Clothing and clothing accessory stores were up 2.2%. Electronics and appliance stores were down 5.7%.
Sportinggoods stores were up 1.7% Furniture and homefurnishings stores were down 1% month-over-month seasonally adjusted but up 7.4% Online and other non-store sales were down 3.7% month-over-month seasonally adjusted but up 13.9% unadjusted year-over-year. General merchandise stores were down 0.2%
Furniture and homefurnishings stores were down 2.1% Sportinggoods stores were down 0.8% Electronics and appliance stores were down 3.4% month-over-month seasonally adjusted but up 90.8% unadjusted year-over-year. month-over-month seasonally adjusted but up 64.7% unadjusted year-over-year. unadjusted year-over-year.
This leads to lower turnover of 3-4x across furniture and homefurnishings. Recreation Retailers Recreation retailers cover diverse products ranging from toys to sporting equipment, leading to a wide range of turnover ratios based on seasonality, purchase frequency, and changing consumer trends.
And two categories that were down for the year we’re homefurnishings and electronics which is interesting to me in a little surprising. Overall e-commerce hit like our two-year forecast so it was a doubling not a 10 Xing. [14:00] Scot: [16:32] Risk is a Wayfarer has really picked up nicely.
It did and then, furnishings and furniture and HomeFurnishings grew at 21 percent so about the industry average and again because of all the money people spend on their homes I kind of would have expected that to be higher so those two things.
Sportinggoods stores were up 0.5 Furniture and homefurnishings stores were down 1.3 Online and other non-store sales were down 0.7 percent month over month seasonally adjusted but up 12.3 percent unadjusted year over year. Grocery and beverage stores were up 0.5 percent month over month seasonally adjusted and up 7.1
November sales were up in all but three categories on a monthly basis and were up across the board year-over-year, led by increases at clothing, sportinggoods and furniture stores. Sportinggoods stores were up 1.3% Furniture and homefurnishings stores were unchanged month-over-month seasonally adjusted but up 18.6%
October sales were up in all but two categories on a monthly basis and were up across the board year-over-year, led by increases at clothing, electronics and sportinggoods stores. Sportinggoods stores were up 1.5% Sportinggoods stores were up 1.5% Furniture and homefurnishings stores were up 0.4%
Despite month-over-month declines in two-thirds of retail categories, April retail sales increased across the board on a year-over-year basis, led by massive increases in retailers like clothing, furniture and sportinggoods stores that were ordered to close last spring. Furniture and homefurnishings stores were down 0.7%
Furniture and homefurnishings stores were down 3.6% Sportinggoods stores were down 1.7% Specifics from key retail sectors include: Clothing and clothing accessory stores were up 2.6% month-over-month seasonally adjusted and up 49.4% unadjusted year-over-year. Electronics and appliance stores were up 3.3%
9:14] Shifted into retail and that gave sportinggoods and building materials a big a big kiss. 9:14] Shifted into retail and that gave sportinggoods and building materials a big a big kiss. The sale leaves the sportinggood category in enters the non-store category and so that’s.
Sportinggoods stores were up 23.5% Furniture and homefurnishings stores were up 5.9 Specifics from key retail sectors include: Clothing and clothing accessory stores were up 18.3% month-over-month seasonally adjusted and up 104.6% unadjusted year-over-year. month-over-month seasonally adjusted and up 78.2%
We organize all of the trending information in your field so you don't have to. Join 40,000+ users and stay up to date on the latest articles your peers are reading.
You know about us, now we want to get to know you!
Let's personalize your content
Let's get even more personalized
We recognize your account from another site in our network, please click 'Send Email' below to continue with verifying your account and setting a password.


Let's personalize your content