
Many digital transformation initiatives are failing. In fact, 85% of digital transformations are slowed down or derailed by integration challenges. Why? Because various disparate systems and legacy infrastructure are barriers.
Data is siloed. The pace of change is accelerating. As a result, companies are often disconnected from the data that helps them understand what’s happening with their customers, partners, and employees. Add to that new regulatory requirements and the fact that not everyone has the right skills to deliver on ever-changing customer expectations. The complexity is massive and compounding, and the need for speed and agility is increasing.

Traditional integration approaches can’t keep up because:
- Custom code is brittle, it breaks easily, and you always have to go back and fix it.
- Custom code is a bottleneck because it’s understood by very few people and lacks standardization.
- Custom code is rigid and hard to change, so you get stuck and can’t evolve.
Challenges of digital transformation
Given these realities, where do you start? At the heart of the digital transformation is data. But today, it’s very likely your data and processes are highly fragmented, living in hundreds of different systems and apps, making it really hard to unlock that data.
Without the ability to easily and quickly integrate and unify data, you can’t deliver the connected experiences your customers demand. That’s why integration is the main reason new initiatives fail. If you leverage traditional integration approaches, you won’t be able to deliver innovation at the level and speed needed to meet rising expectations. So it’s no surprise that customers and citizens are often frustrated by the poor service they experience from service providers.
- Customer: Customers are feeling the pain of poor, disconnected experiences and their expectations for personalized, seamless engagement are rising in different sectors such as retail, insurance, banking, etc.
- Patients: Patients are frustrated with the challenges they face when scheduling an appointment, seeing claims submitted by healthcare providers, or reviewing their lab results as they have to log in to multiple disparate systems.
- Employees: Employee productivity is a concern for most companies as they are challenged with managing more remote employees and employees get frustrated with spending time searching for data from different systems.
- Students: Students are forced to log in to various systems to see their grades, access course materials, and search for scholarships, and staff have a hard time getting a holistic view of each student
- Citizens: Citizens are frustrated because applying for benefits and accessing government services requires manual steps and entering their information in various systems repeatedly.
Composability for digital transformation
MuleSoft believes composability is the future of innovation. With a composable enterprise, you can unleash seamless digital experiences, faster to your employees, customers, and citizens by composing your data, processes, and applications. Your data, processes, and applications become digital capabilities or “building blocks” that are exposed so that others can securely discover, access, reuse, and “compose” these assets into new products, services, and capabilities.
In a composable enterprise, there is a standard way to unlock data and connect systems, as opposed to integration being a secondary concern, leaving much more bandwidth for business innovation.

Organizations need to unlock and unify data across their entire organization and make it easy to consume and compose. The diagram above shows how a retail app can be composed of various APIs as “building blocks” to provide the best customer experience and capabilities.
- Google Maps API to show their store location
- Stripe payment service API for payment processing
- UPS API for shipping notifications
Accelerate digital transformation using Anypoint DataGraph
MuleSoft can help you accelerate digital transformation with AnyPoint DataGraph as part of an API-led connectivity methodology. Anypoint DataGraph enables you to create a 360-degree view of your customer data by unifying all the data within your applications. In a traditional approach, consuming many APIs at a time requires significant work as custom code is needed to parse the data for each response.
With MuleSoft’s Anypoint DataGraph:
- Unify APIs into powerful data services: Explore, unify and serve data from all your APIs into powerful services, without new code.
- Consume many APIs in a single request: Enable developers to consume multiple APIs at once with a single, visually built GraphQL query.
- Reach new levels of productivity: Replace custom code for many API requests with a managed service that requires no maintenance.
Anypoint DataGraph accelerates productivity within your organization while reducing the burden on IT and Ops teams. Developers no longer need to build low-value APIs that just join data from other existing APIs – they can focus on their actual application logic.
IT and ops teams have fewer APIs to manage and secure; the single endpoint created with Anypoint DataGraph runs as a SaaS app, with no maintenance or patching required. Here’s an example of how you can create an employee 360-degree view by using Anypoint DataGraph:
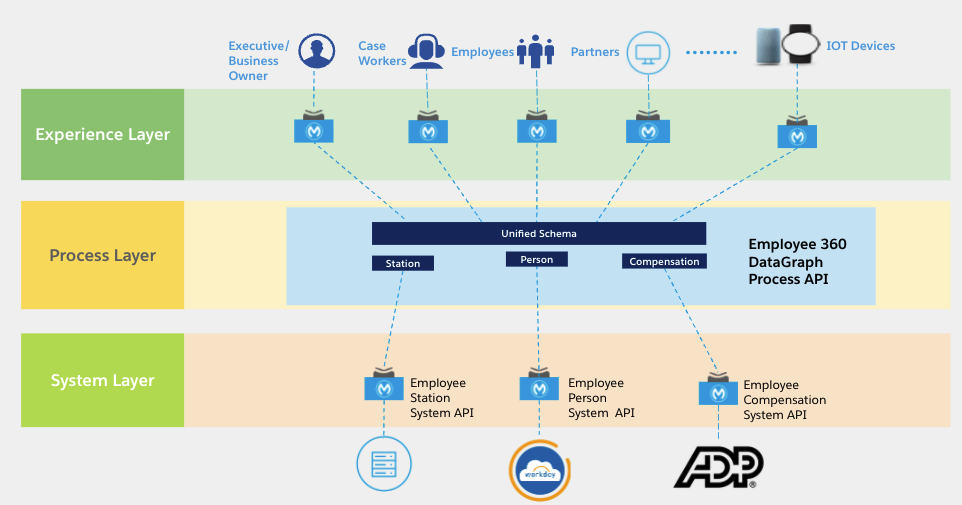
The diagram above shows the MuleSoft API-led connectivity approach which has three layers: System, Process, and Experience layers.
System layer APIs are used to unlock core data from systems of records, legacy, and SaaS applications. The Process layer is used to compose data from System layer APIs to create a 360-degree view of data by using Anypoint DataGraph. The Experience layer is used to deliver an experience to different personas via different channels such as mobile, web, IoT, and more.
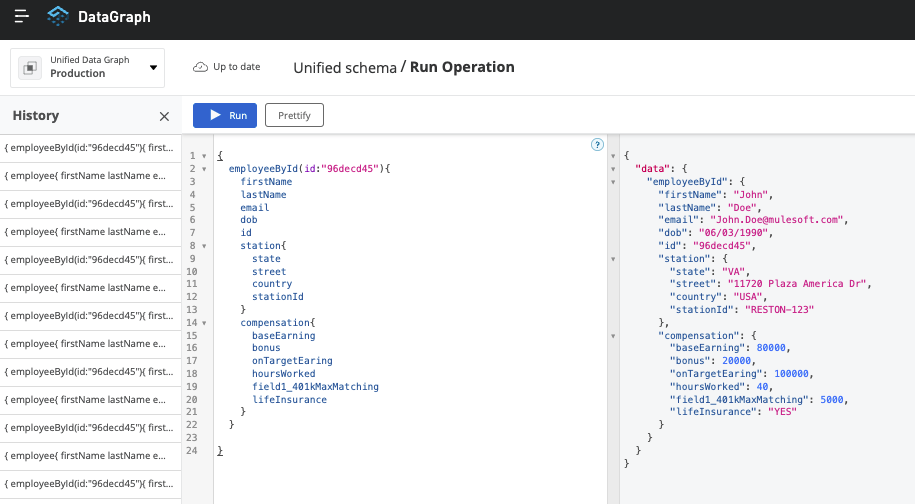
Anypoint DataGraph uses a GraphQL query language to fetch data defined in the schema. You have the capability to query customer-specific or the whole customers in general for business decision-making visualization purposes as shown above. Anypoint DataGraph helps your organization to accelerate your digital transformation by defining the 360-degree view of data with low- or no-code features.
Here are some use cases that you can innovate in your organization by using this Anypoint DataGraph:
- Customer 360 connects your marketing, sales, commerce, service, and IT teams with a single view of your customer data, helping you grow relationships with your customers.
- Citizen 360 pulls data from various disparate programs that focus on the person and their needs so that the health, safety, and well-being of citizens can be improved.
- Patient 360 improves accountability and transparency of relationship with the patient and the healthcare provider, empowering patients to take charge of their own health.
- Employee 360 enhances the relationship between managers and individual contributors to make informed decisions by pulling data from different sources on how the individual is making an impact within the organization. In addition to this, it also makes your employees’ lives easier by pulling in employee data from different sources.
- Student 360 strengthens the relationship between students and professors/career advisors by pulling data from different sources on scenarios such as accessing updated course materials, grade reports, announcements, scholarships, providing feedback, and wellbeing
Want to learn more about Anypoint DataGraph? Watch our webinar on consuming and reusing your APIs faster with Anypoint DataGraph.