[vc_row][vc_column width=”2/3″]
Most digital store owners are quite familiar with zone-based user tracking solutions. Google Analytics alone can provide valuable and actionable insights per user and per a number of demographics. However, there are digital tools that provide even more insight at a page level, showing you the user journey across specific web pages, helping you understand what they want, and how much time they spend on specific parts of that said page.
Too few people realize this is completely possible for retail stores too; that you can track your customers’ journey across your shop starting from the storefront and gain accurate data on where exactly they spend the most time, what route is taken the most often, what zones are throughout your store are barely visited. People counting technology got to a point where you can obtain reliable and accurate information on which specific items in your inventory are getting the most interest and help you understand what your customers want better.
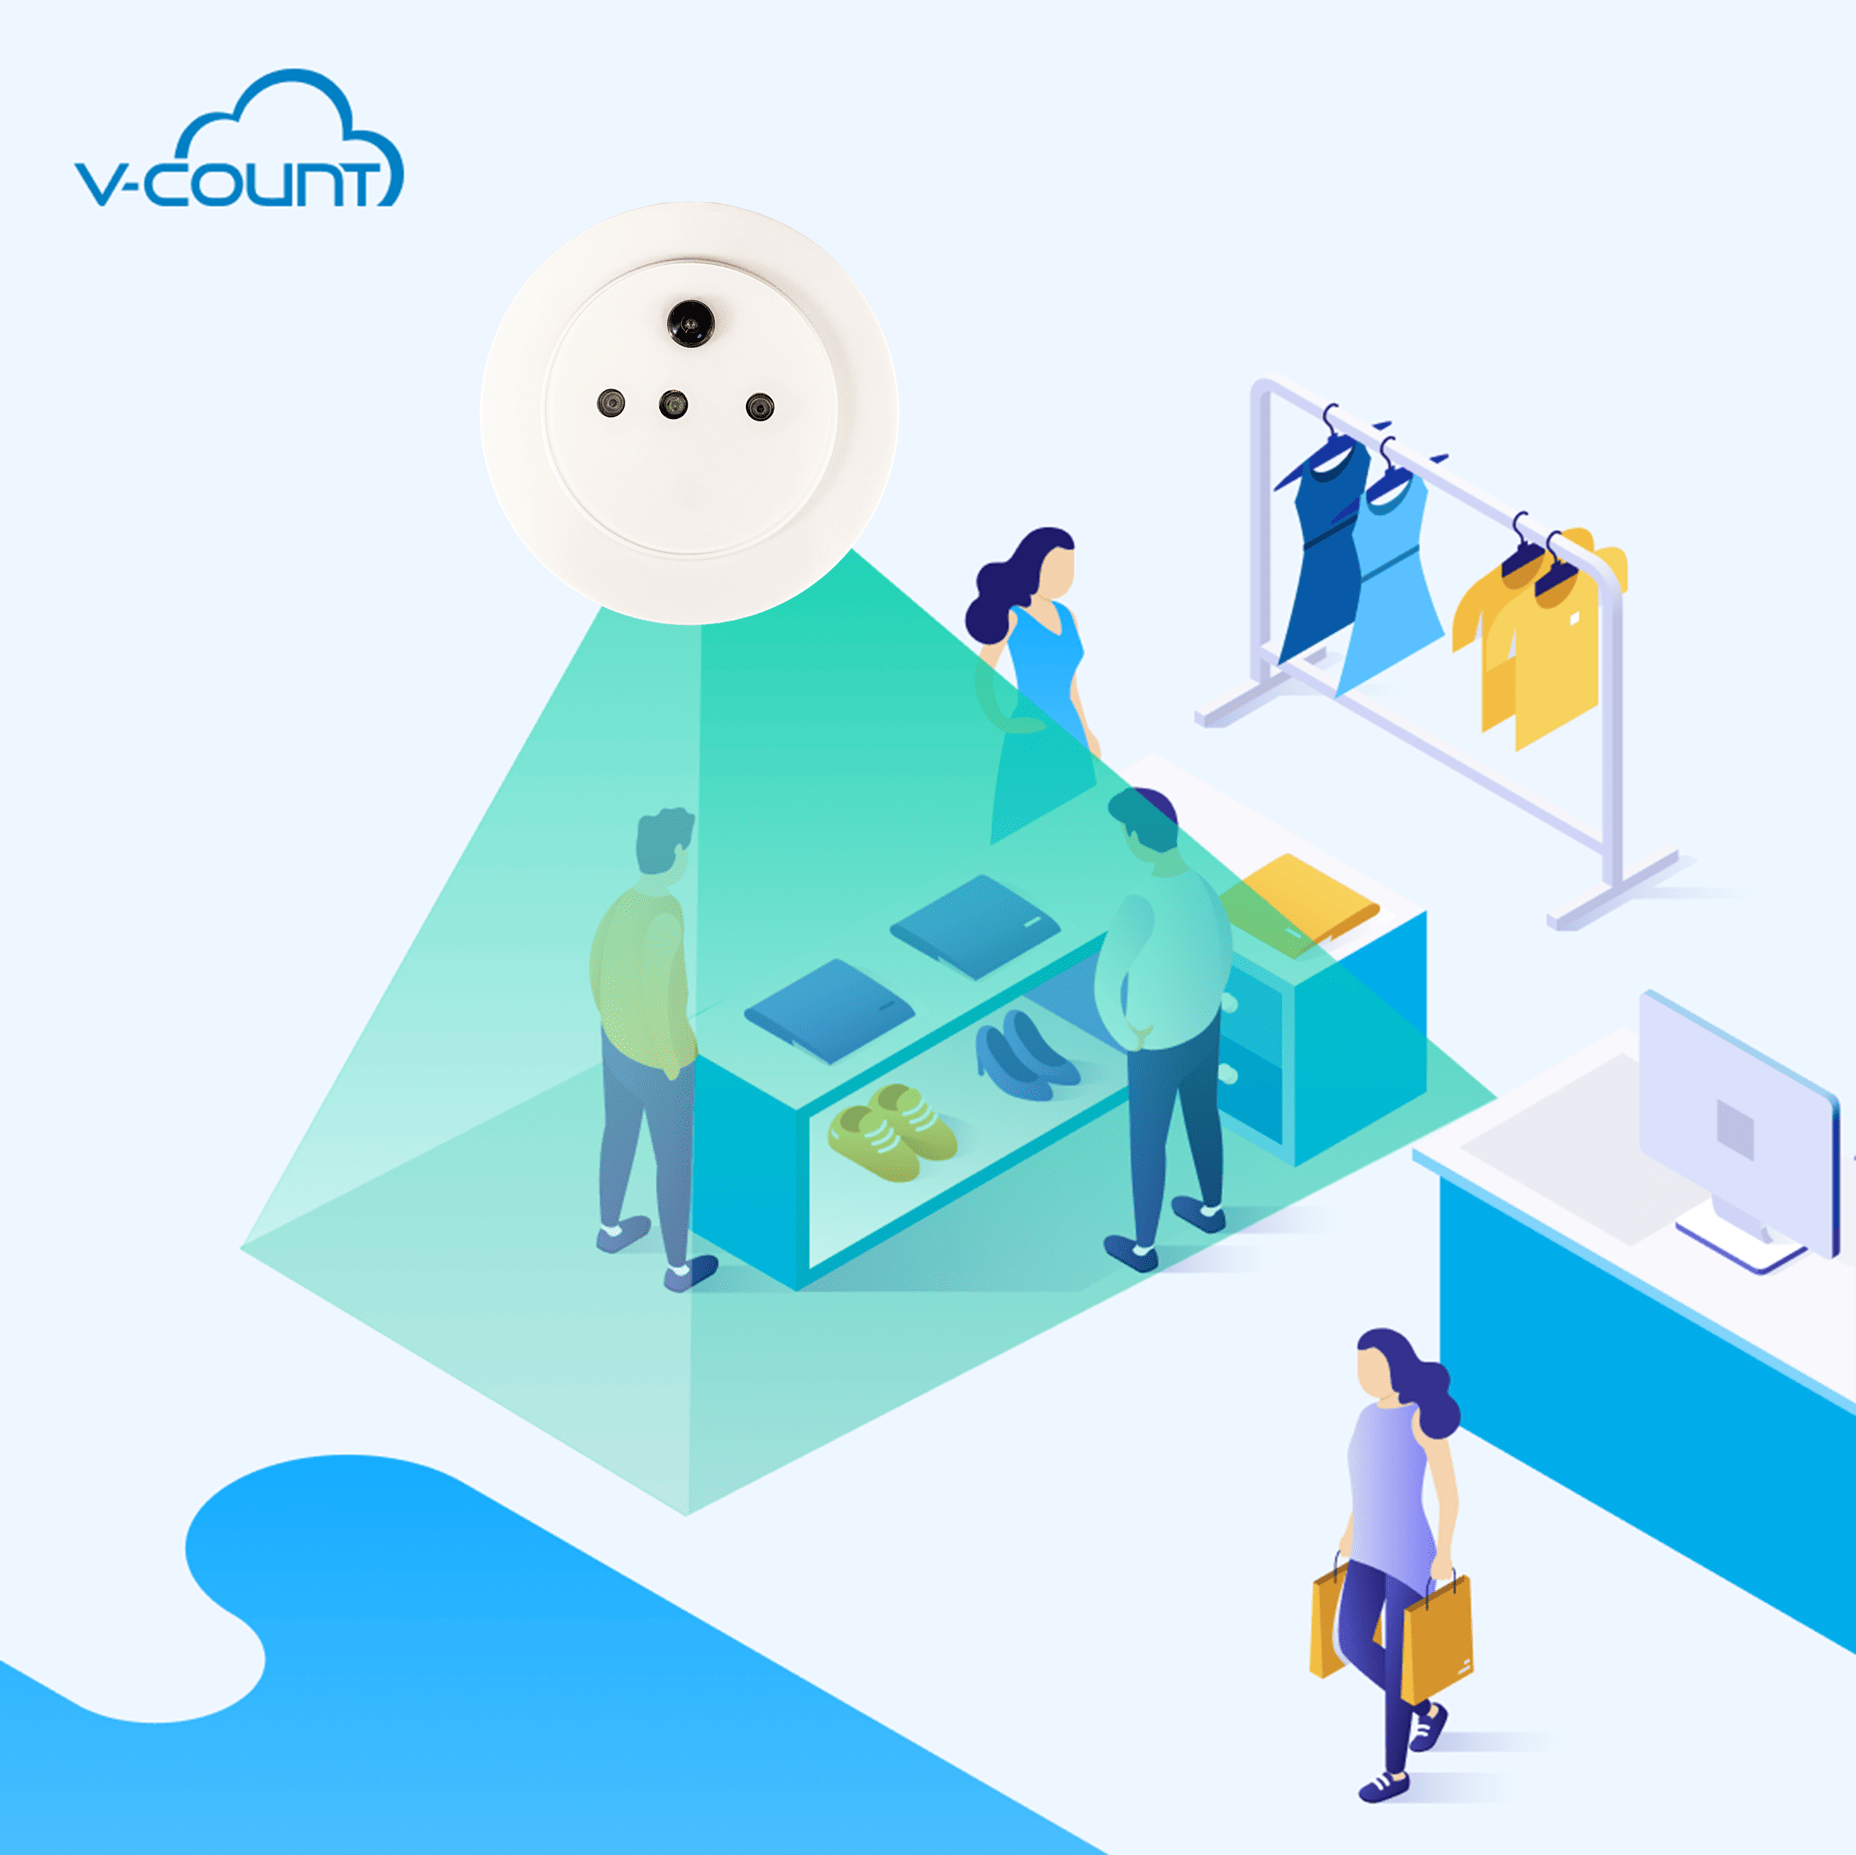
Having said all of that, not all people counters are built the same and most can’t pull what V-Count’s Ultima Prime can. Some do claim they can provide accurate zone analytics data while lacking the necessary underlying technology, though. In our case, not only do we use the leading technology in people counting solutions we develop it in-house. All V-Count sensors use 3D Active Stereo Vision and are developed by our engineers, offer up to 99.9% accuracy.
The data collected by sensors are sent immediately to our online dashboard, Business Intelligence Platform (BIP), and here they’re visualized into intuitive graphs and charts segmented in various ways. The cloud-powered dashboard is also developed by the V-Count team and we regularly update it based on the customer feedback we receive to make it more helpful and help your stores maximize their performance.
In this article, we’ll dive deeper into what zone analytics is, how it works and how a retail store can leverage it to better perform across all metrics. If you’re already familiar with zone analytics solutions and interested in learning more, you can reach out to us now and we’ll get you connected with one of our experts in no time.
What is Zone Analytics and How Does It Work?
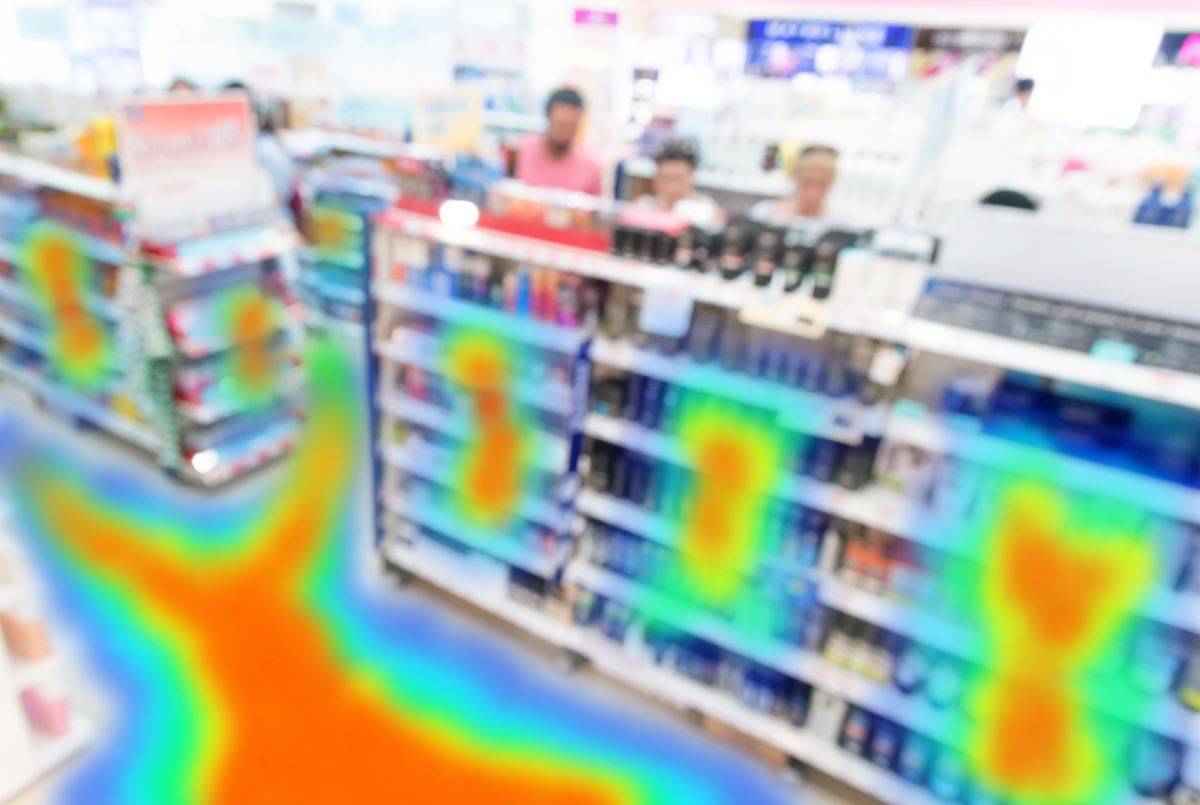
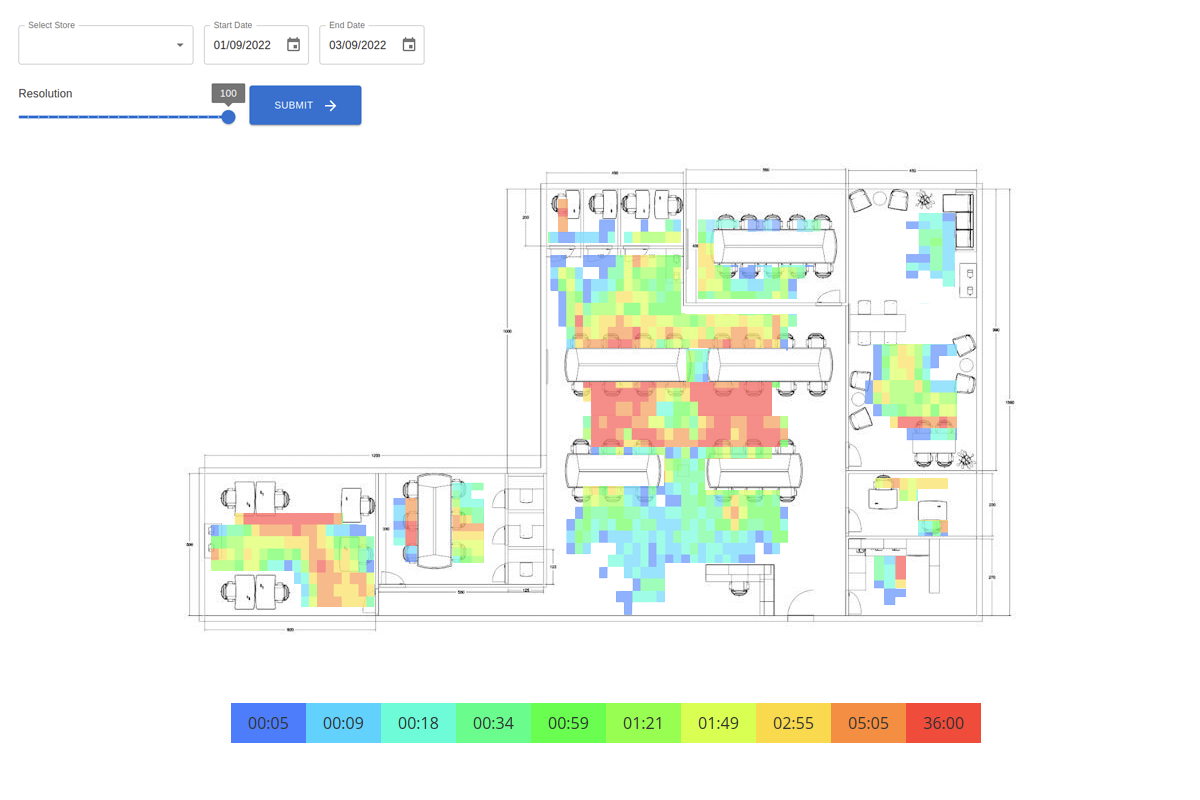
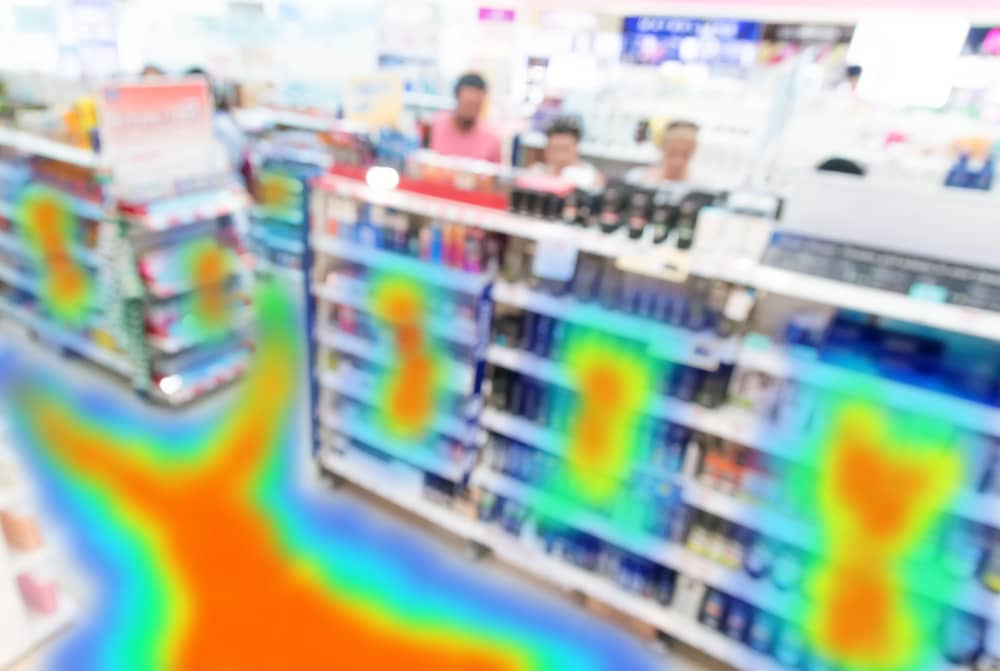
In people counting, zone analytics refers to measuring visitor interest in physical locations. We measure visitor interest by counting the number of people passing by or dwelling in a specific zone. Ultima Prime creates extremely accurate heatmaps via its state-of-the-art fisheye camera and uses a unique grid system that lets you control the resolution so that you can zoom in and out and analyze even the smallest sections of your store.
The grid system can help you pinpoint which items in your selection are the most popular or give you insights into why an item catches a lot of attention but doesn’t sell as nearly as it should, per your campaign goals.
Our user-friendly online dashboard gathers the data and transforms it into actionable, visualized insights while putting you in control of everything. You can use a wide number of filters to pinpoint what kind of data you want to see exactly to help with your marketing and sales goals. You can use zone analytics to see the visitor count and dwell time per grid. It also shows you the customer journey and visitor flow across your stores. There’s also a heat mapping solution to demonstrate customer engagement levels for each zone you create. Putting it all together, you can use the visualized data to reduce energy costs at your store.
If this sounds a little overwhelming, fear not and just get in contact with us. We provide worldwide support and our advisors can help you find the most suitable solution for your retail business.
Which Solutions Work With Zone Analytics?
At the time of writing, Ultima Prime provides the solutions listed below;
Zone Analytics Visitor Count: Counting traffic in and out of your stores is fine, but setting up pre-defined zones and specifically knowing how each zone and product that relates to the zone performs is even better. Ultima Prime powered up with zone analytics exactly delivers this. The solution gathers visitor data for each zone you set up (you can set up zones and adjust grid size via the online dashboard) and shows you which areas are performing the best, and which fail to deliver.
Zone Analytics Dwell Time: Dwell time refers to the amount of time your customers spend in a grid/zone. This data helps you understand which products and services are most desirable to your customers and gives you valuable insights into what they want and need. Knowing how long they spend in a specific zone, combined with other solutions can help you boost sales and bring forth some growth opportunities.
Visitor Flow: Working together, Ultima Prime and BIP can track each customer and map out their journey throughout your store in an intuitive and easy-to-understand way, and it does it while being 100% GDPR compliant. It does protect the privacy of your customers while providing you with actionable data to understand the customer journey.
How you may use this data is up to you, of course, but one thing is for sure, knowing and understanding why something works and resonates with your customers is a powerful weapon for your future marketing campaigns.
Heat Mapping: The heat mapping solution combines visitor count and dwell time for each zone and creates a visualized representation of data in the form of a map that’s displayed as colors. This way, you can easily get an idea of which zones in your store are performing well and attracting customers. Accurate and reliable heat maps can help with improving conversion rates.
How Can a Retail Store Leverage Zone Analytics
Keeping up pace with today’s world can be tiresome, sometimes complicated even and this eventually leads to inefficient, unorganized, and unoptimized workflows. Efficiency alone can be a game-changer for your retail business. A well-organized store can drastically improve customer experience, and increase customer loyalty. A happy and loyal customer will always come to shop for more.
Enhance Store Layout: Dwell time and visitor flow are two key metrics that can translate what your store is telling you and your customers want from your business. These two together give you all the information you need on customer behavior and buying habits, how each zone compares to one another, and more. You can use the information to optimize and enhance your store layout and even experiment with some marketing strategies.
Optimize Product Placement: Using the grid system you can pinpoint exactly which products perform better and catch the attention of customers. Discovering what makes your customers engage with specific products can significantly improve your overall store performance.
Improve Marketing Effectiveness: You can create data-driven marketing strategies when you have all the core information you need per zone. You can then analyze the effectiveness of campaigns and events in different zones to increase profit margins.
Optimize Staff Allocation: Zone analytics will show you how active your store is and when it is the most active, and of course in which places. You can hire new people or optimize the work schedule of your staff according to the traffic your store pulls. You can address customer needs in a more efficient way, and ensure they always get the help they need at your stores. Not only will you have happier customers, but happier staff members as well.
Reduce Energy Bills: You can use zone analytics data to find out which parts of your stores are barely visited and can use less energy. It can also help you find out the exact number of employees (and work hours) your store needs in order to run efficiently. Hiring more people than you need to is always a costly mistake.
Conclusion
Viewing your store’s customer traffic data in map format in a reliable and accurate way can help you drive more sales, increase profit, help build brand loyalty and futureproof your retail business in numerous ways. There’s a reason why every digital store, no matter what they sell, invests in traffic analytics tools and pays the extra buck for the ones which can provide zone-based analysis. V-Count brings that to physical spaces in a user-friendly way, so that your business can thrive.
If you have further questions about how traffic counting can help your business, reach out to us now and we’ll help you figure out what your store exactly needs.
[/vc_column][vc_column width=”1/3″][vc_widget_sidebar sidebar_id=”sidebar-9″][/vc_column][/vc_row]