This is the second blog in a three-part series on how APIs can be used to maximize the value of data in a digital organization. Part one examined the economic properties of data, and principles of how digital organizations should treat data.
In “Dragon Psychology 101” — an episode of the podcast Revisionist History — Malcolm Gladwell recalls the New York City Metropolitan Museum of Art’s financial struggles in 2018. Facing a potential $40 million deficit, the Met started charging minimum entrance fees and laid off dozens of workers.
How could a museum with 2 million artifacts in its collection — including 18 Van Goghs, 20 Rembrandts, and 46 Picassos — be struggling financially? The artful answer is that the museum couldn’t bear to part with any of its items. The economic answer is that the museum’s collection was not even counted on its balance sheet. In the “assets” category, there was literally a line item for the collection with an attributed value of $0. This must be why high-end art is called “priceless.”
Practically speaking, works of art would be tricky assets for any organization to cash in during a financial crisis. Not only are there wild fluctuations in value, but many of the Met’s items were themselves collecting dust in a New Jersey warehouse. In economic terms, an institution’s ability to convert its assets into usable cash is known as “liquidity.”
By this definition, the Met’s collection is low on the liquidity scale. On the other end of the spectrum is cash, the most liquid asset. Companies with a high ratio of liquid assets are generally seen to be more financially healthy and agile. While listening to the podcast, I couldn’t help but relate it to the work I’ve been doing lately on the economics of data. Clearly, having the most data is not the same thing as having the most data value. In this blog, I will argue that organizations who get the most value from their data are those with the highest data liquidity.
“Having the most data is not the same thing as having the most data value”
In my last blog, I described how organizations can share and correlate data internally to generate maximum business value. Doing this requires data to be centralized, accurate, and complete. I also asserted that the more organizations can get users consuming their data, the more value they can generate from that data. Furthermore, to protect the value of the data, they need to make sure that only the users they want to consume the data actually do.
Making data as consumable and protected as possible means decentralizing its distribution, thinning it out to fit the consumer’s context, and optimizing performance to make it ephemeral on the organization’s perimeter. Thus the design principles between sharing data internally and exposing it securely for consumption are in direct contention, as depicted in Figure 1 below.
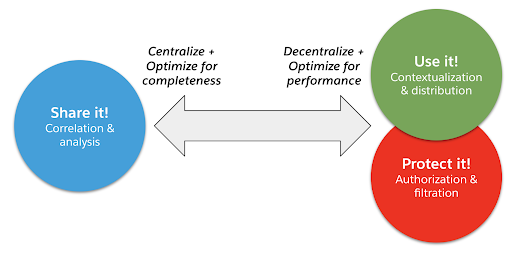
Figure 1: Contention between sharing data internally and packaging it for consumption
Data worlds will collide
These two contentious sources of data value are vividly apparent when examining the history of data processing. Over the past several decades, two worlds of data processing have emerged: OLTP and OLAP.
OLTP (online transaction processing) is the world of customer- and user-facing real-time applications, while OLAP (online analytical processing) is the world of business reporting and decision support. OLTP generates value from data through consumption and protection, while OLAP generates data value through sharing and correlation.
These worlds have evolved somewhat independently, with different roles, usage scenarios, and tech stacks. While both worlds have been revolutionized by cloud computing, the resulting paradigm shifts have been different. OLTP is in the throes of microservice architecture, DevOps culture, and distributed, cloud-native technologies. OLAP’s current phase features cloud data warehouses (or lakes), data science, and data engineering. Both worlds coexist as effectively as they always have, but new forces are causing them to converge.
Improved processing capacity and innovative data technologies are removing some of the historical barriers between OLAP and OLTP. Notably, data streaming — especially the rising popularity of Apache Kafka — has enabled real-time movement of data to both source analytical pipelines and provide event-driven integration of operational systems. Machine learning creates models out of warehoused data that can be embedded in user-facing applications. Increasing use of SaaS applications means data engineers must be fluent in the web technologies of the operational world.
This brings us back to the concept of liquidity I raised off the top. We can look at data liquidity as a measure of how effectively organizations can traverse the gap between the OLAP and OLTP worlds.
Data value: from chain to cycle
Figure 2 shows how data value has historically been generated with respect to analytical and operational systems:

Figure 2: Traditional data value chain
In this case, there is a process to ingest, prepare, and transform data before it can be analyzed. This could be done by pulling data from disparate applications and databases, using an ETL tool to batch them up, and then using BI tools to perform analytics. The next link in the chain is incorporating the BI insights into user-facing applications. Often, this can be a manual process involving a full blown development lifecycle to complete. Considering the pace of business in the digital economy, there is a tremendous amount of latency in this approach. Data liquidity is low.
Ideally, organizations want a data value cycle that minimizes latency and closes the loop, allowing data value to flow from the OLAP world to OLTP and back. Figure 3 shows how high data liquidity can be achieved using innovative technologies and insights into the economic properties of data.

Figure 3: Innovative data value cycle
Here, user-facing applications provide source data that is collected by — and possibly streamed to — analytical systems. Insights are derived from the data, potentially in the form of a machine learning model that can be deployed via pipeline to the operational world, and contextualized into user-facing applications. Users who consume these applications generate new data and metadata that can be collected and easily correlated with existing data, which could lead to new insights or trigger model re-training. And so on. The data value cycle continues in perpetuity. But how can an organization implement such a liquid setup?
API locks in the data canal
Connecting the OLAP and OLTP worlds is gaining increasing focus in the field of data engineering. Sourcing data from operational systems has always been a focus, but approaches are evolving. ETL is morphing into ELT, with lightweight technologies like DBT taking off. Batched data is being replaced by streams. Local sources are being augmented with SaaS sources.
However, the movement of data from analytical systems into operational systems is less of a paved road. The data engineering community is using the term “reverse ETL” to describe this area. Data scientists creating machine learning models call it “model deployment.” The industry has not yet landed on anything near a standard approach. So here I will propose an approach that allows the OLAP and OLTP worlds to maintain most of their independence, while creating the right conduits between them to let data value flow.
“APIs are the most liquid form of data”
Last year on the APIs Unplugged podcast, Sanjna Verma shared the story of building the Salesforce COVID-19 Data Platform. It’s a phenomenal story, but I want to zoom in specifically on how data flows through the platform from raw sources to user consumption.
The COVID-19 data platform spans both data processing worlds, OLAP and OLTP. The OLAP portion features a standard data pipeline approach, with ingestion, preparation, storage, and analysis. SQL is the native tongue of this world. However, the lingua franca used in the platform to bridge OLAP to OLTP is web APIs. External sources of COVID-19 data, like the New York Times and the ECDC, were normalized and ingested via APIs. The curated data entities required for consumption were exposed as APIs. Lastly, APIs were provided to specific channels — internal Salesforce applications, partner solutions, external developers — to help contextualize the data for optimal user experience. If liquidity is the measure of how data flows through an organization, how easily data can be presented in the right shape in the right place at the right time, then APIs are the most liquid form of data.
API-led data connectivity
It is not just APIs that drive data liquidity. If we examine the use of APIs in the Salesforce COVID-19 Data Platform, we see that APIs are being used in three distinct layers within the platform’s architecture.
First, they’re used to ingest crude data from sources to feed the analytics pipeline. Secondly, APIs are used to expose the core entities of the data warehouse. Lastly, the data is contextualized through a third layer of APIs closest to the point of consumption. This layered approach makes the platform’s data composable, and was the reason so many new sources and consumers could be added in such a short period of time. A generalized version of this layered data API architecture is depicted in Figure 4.
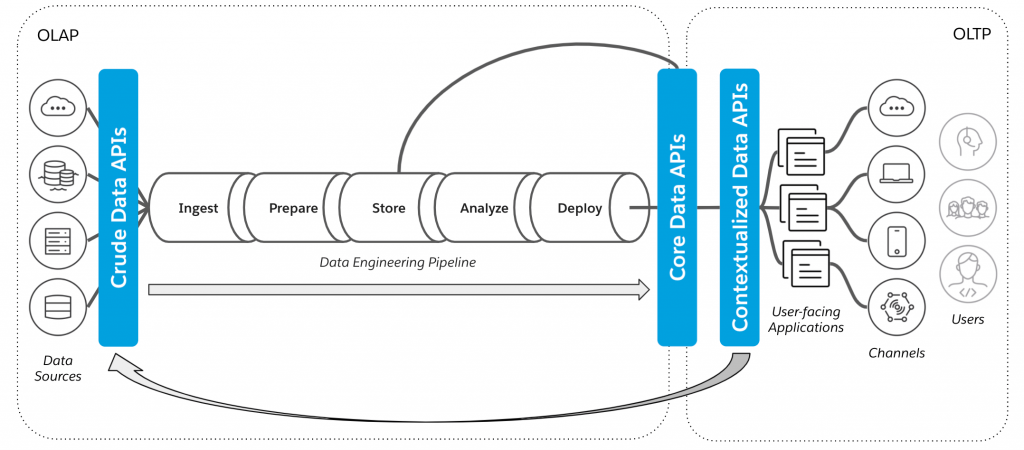
Figure 4: Layered APIs bridging the the OLAP and OLTP worlds
Note that It is possible to feed new data generated by the consumption of existing data back into the pipeline. That detail allows us to close the loop and use this layered approach to implement the data value cycle depicted previously in Figure 3. Similar to the way API-led connectivity allows an organization’s business capabilities to be composed in automations, user experiences, and newly-packaged products, API-led data connectivity (ALDC) allows organizations to interoperate between their disparate data worlds while allowing those words to remain intact. ALDC gets data as efficiently as possible to the right consumers, while providing modularity in the architecture to make organizations more adaptable to change and allowing for optimal reuse of data assets. Figure 5 illustrates the relationships between the layers, and how they map to the data value cycle.
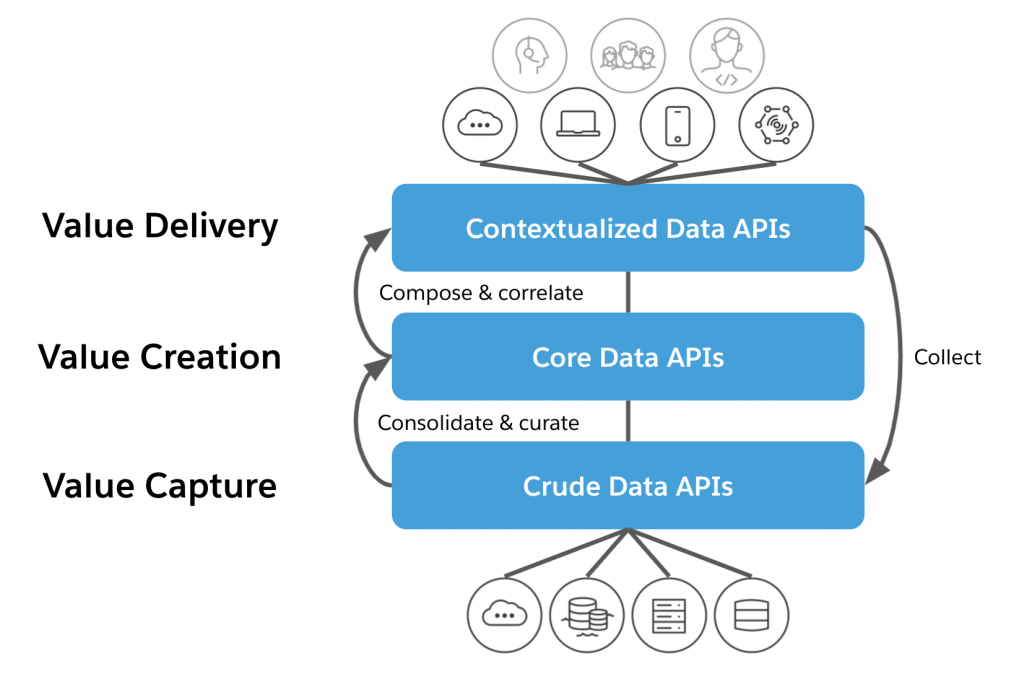
Figure 5: API-led data connectivity (ALDC)
Like most areas of the digital economy, dealing with data is becoming increasingly complex. However, due to the unique economic value of data, those companies who deal with it most effectively — who achieve maximum liquidity— will be well-positioned to thrive in the digital age.
API-led data connectivity is a method of liquefying data value and creating composability for data assets. Future posts in this series will examine how ALDC can help provide the solid protection mechanisms for data — the third leg in the data value stool — as well as walking through some examples of ALDC in practice. For now, I hope this blog post will help you get those dusty data assets out of the warehouse and arm you to slay some digital dragons.
Thanks to Sinan Onder, Belen Roca, Radu Miclaus, Craig Bayley, and the SE Daily podcast for inspiring this piece.