MuleSoft’s comprehensive logging system provides detailed information that you can use to optimize performance, identify potential security issues, and better inform both your technical and strategic business decisions. The tools MuleSoft provides to analyze this data can be helpful when you’re starting out, but data-centric organizations will rapidly hit a wall. Thankfully, MuleSoft provides the possibility to externalize application logs to third-party services.
External logging platforms allow users to configure custom dashboards, apply filters, receive monitoring alerts, and much more. These features are all focused on finding the right information faster and presenting it efficiently, saving time for implementers and technical managers while reducing costs for the organization. The best of breed solutions allow teams to configure custom metrics and design diagrams using custom input data. Offloading these logs to a third party also means you’ll have access to them even when the applications they reference fail or disappear, allowing operators to reconstruct the events that led to the crash.
There are many players in the space for you to consider, but the Graylog platform stands out for its dogged focus on log collection and analysis. Competitors like the ELK stack are designed for more general purpose data collection and analysis, making them incredibly powerful tools with complicated management and configuration. Graylog’s narrow focus belies a powerful set of features that make it easier for individuals and teams to manage and monitor their MuleSoft applications.
The Graylog platform can receive messages using a variety of common protocols, including HTTP, UDP, TCP, and more. Its fully customizable and configurable dashboard allows teams to create visualizations for their data that focus on what they find important. Administrators may configure custom alerts to send email or HTTP notifications triggered by specific application or server events, and the Streams function allows for custom rules-based routing of incoming messages.
Configure Graylog’s input
To start exploring the possibilities, you’ll first need to access the Graylog Platform. This article assumes you’ll be using the Graylog Open Source product on a local machine, though the same steps should apply when using their enterprise or cloud managed solutions. More information can be found on the Graylog site.
You must first configure a new input configuration in Graylog to receive messages from our MuleSoft application.
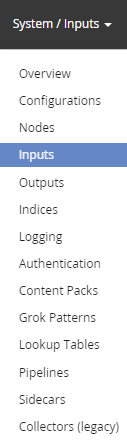
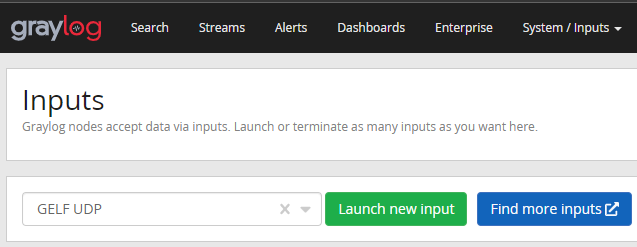
Look for and click on the “Inputs” option under the “System / Inputs” option in Graylog’s top navigation.
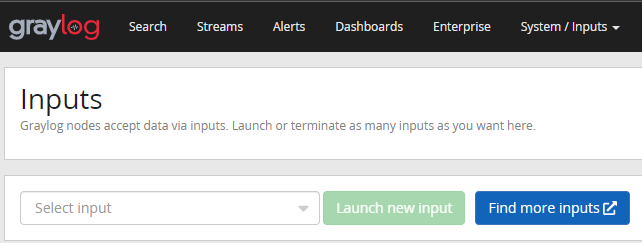
The Inputs page prompts you to select a new input. For this example, we’ll use “GELF UDP,” which is Graylog’s Extended Log Format. GELF UDP allows for the fast collection of more data than traditional loggers like syslog can handle. Select the option labeled “GELF UDP” from the dropdown and click the ‘Launch new input’ button.
Next, configure the GELF UDP connection so it’s ready to listen to events sent by your application. Start by selecting the node representing the Graylog installation you want to configure. If you’re only running one instance of Graylog, there should be only one node in the dropdown. Then, provide a title for your input configuration.
You must also define the UDP bind address and port that the Graylog server will listen on and MuleSoft will use to submit events. In the example below, we’re running Graylog in a Docker container, so we’re binding to the UDP broadcast address of 0.0.0.0. In production, you may consider supplying a fixed IP address to limit how Graylog can be accessed. Select any open port number for the port value.
NOTE: You will need to remember the host IP and port you selected when you configure MuleSoft in the next steps.
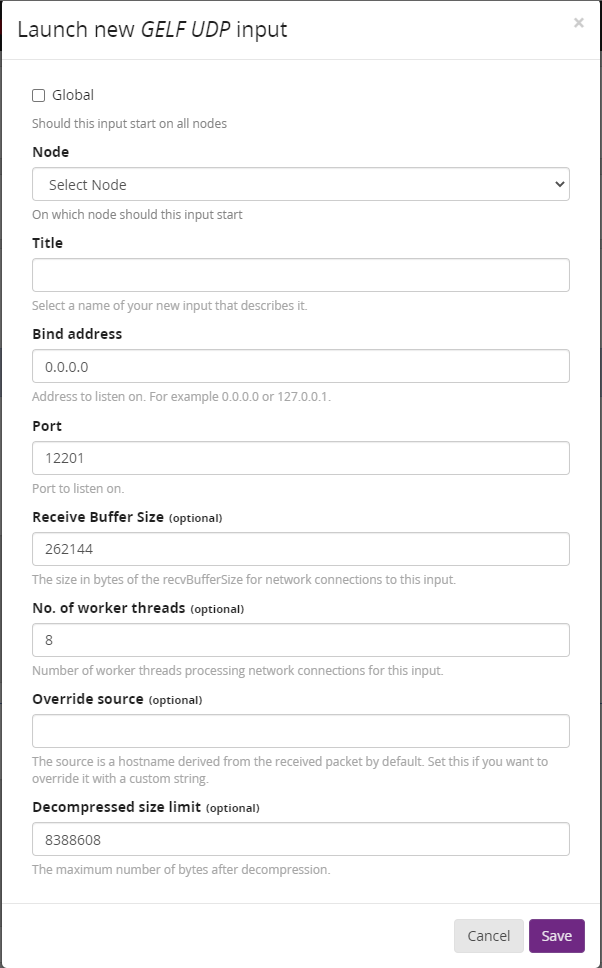
Then, save the input configuration.
Configure MuleSoft to push log messages to Graylog
Whether you are creating a new application in MuleSoft or adding logging to an existing project, you will need to edit the project’s Log4j and pom.xml files. If the project exists under another domain, you must also perform these same actions for the files belonging to the domain project.
Configure and define the following package in Log4j, being sure to replace the “originHost” parameter with the fully qualified domain name (e.g. “server.mydomain.tld”) of your MuleSoft implementation and the {host} and {port} values with the ones you configured in Graylog.
<Configuration status="debug" packages="biz.paluch.logging.gelf.log4j2"> <Gelf name="gelf" host="udp:{host}" port="{port}" version="1.0" extractStackTrace="true" filterStackTrace="true" mdcProfiling="true" includeFullMdc="true" maximumMessageSize="8192" originHost="{fully qualified domain name}" additionalFieldTypes="fieldName1=String, fieldName2=Double,fieldName3=Long" ignoreExceptions="true"> <Field name="timestamp" pattern="%d{dd MMM yyyy HH:mm: ss,SSS}" /> <Field name="level" pattern="%level" /> <Field name="simpleClassName" pattern="%C{1}" /> <Field name="className" pattern="%C" /> <Field name="server" pattern="%host" /> <Field name="server.fqdn" pattern="%host{fqdn}" /> </Gelf> <AsyncRoot level="INFO"> <AppenderRef ref="file"></AppenderRef> <AppenderRef ref="gelf"></AppenderRef> </AsyncRoot>Add the following dependency to the project’s pom.xml file:
<dependency> <groupId>biz.paluch.logging</groupId> <artifactId>logstash-gelf</artifactId> <version>1.14.1</version> </dependency>Test your configuration
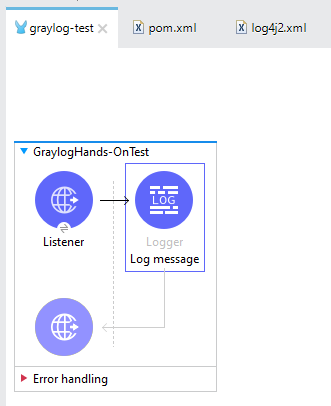
To confirm everything is working as expected, we’ll set up a quick test using a MuleSoft Listener that sends messages through a standard Logger. Requests sent to the listener will trigger messages that are logged on our Graylog dashboard.
- Create a new MuleSoft project with a Listener and Logger. The Listener should use the default configuration and respond to requests sent to the path ‘/test’.
In the Logger, add the message that you want sent to Graylog.
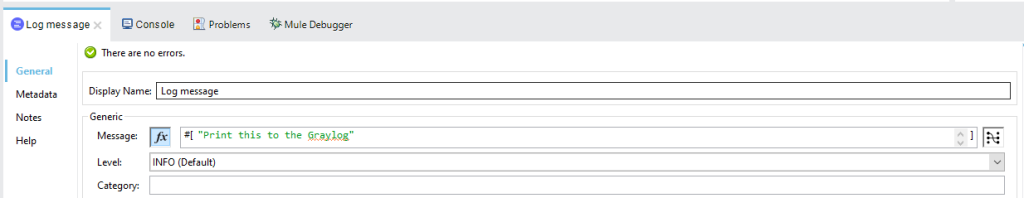
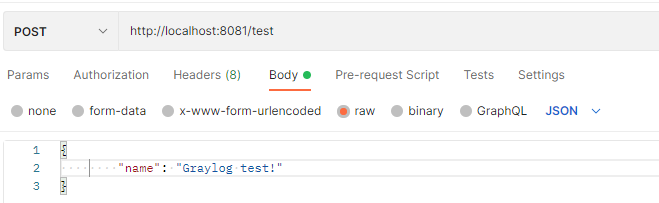
Send an HTTP using curl, Postman, or any other REST API client request with a test body to the endpoint.
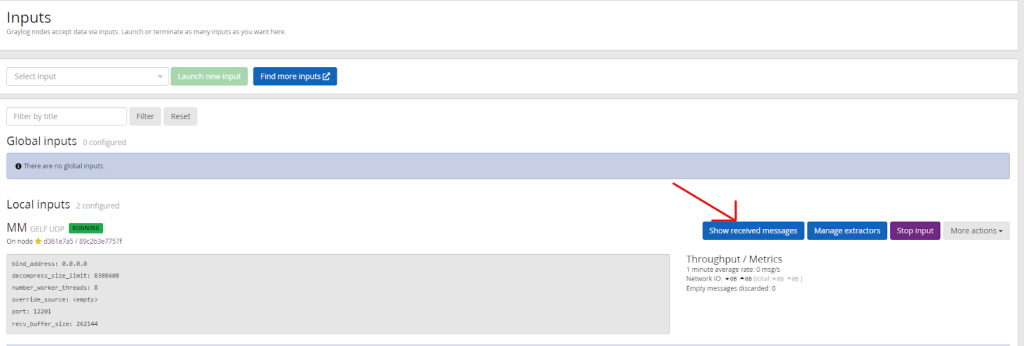
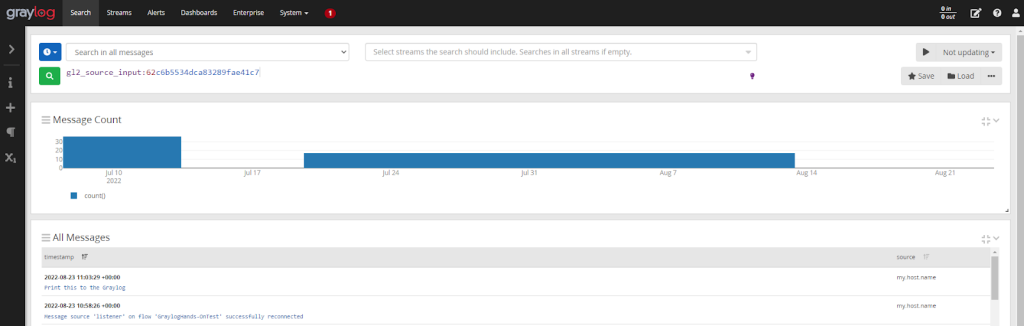
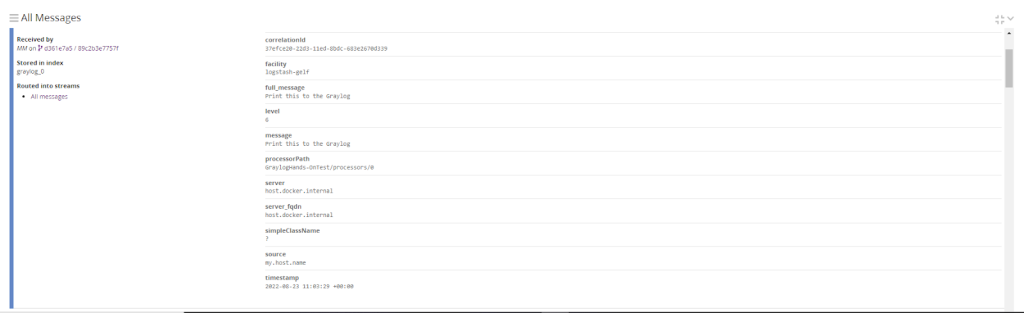
In the Graylog dashboard, find the input you configured and click on the “Show received messages” button. The messages sent by our example will be organized by timestamp in descending order.
Conclusion: Logging in production
You’ve now gone through every step required to send the logs and messages generated by the apps you build in MuleSoft to the Graylog platform. To provide external logging for your other applications, you’ll simply need to go through the same process of updating the pom.xml and log4j configuration files for each of them and in any domains they belong to.
If you installed Graylog locally for this example, you’ll want to take the time to properly implement Graylog in your production environment before sending any mission critical data to it. Graylog provides a number of options: open source self hosting, enterprise support, or a cloud managed solution, which you can learn more about on their site.
Once Graylog is fully implemented and your applications are properly configured, your users are ready to take advantage of Graylog’s extensive feature set. Your team can use the Graylog UI to add new rule sets, set up monitoring alerts, and create custom views and diagrams.
Graylog allows them to customize the system according to their needs to save time and make monitoring more effective. Collecting this data over time can help surface performance bottlenecks and identify potential security concerns. Most importantly, you’ll be able to more quickly find the information you need, making your IT processes more efficient and saving money for your organization.