Extracting and integrating data into your own dashboard
In Part 1, my colleague Mel Delgado gave an introduction to ThousandEyes, and how you can deploy your own ThousandEyes agent at home via a Raspberry Pi. This SaaS platform is all about providing observability in the WAN with agents running in the cloud, on prem, or on your end host. Users will get insights into latency, packet loss, network hops, BGP routing, but also HTTP page load time, DNS server response time, DOM load time and so many more stats! I think it is safe to say that ThousandEyes is collecting tons of meta-data about the health of the whole Internet and specifically to your running services.
ThousandEyes already provides a sophisticated and customizable web-dashboard and this might be sufficient for most users. However, what if you would like to integrate data from ThousandEyes into your own application or dashboard? Or, you would like to use different visualization styles, or even display aggregated datasets? If so, read on!
Extract and Integrate ThousandEyes Data
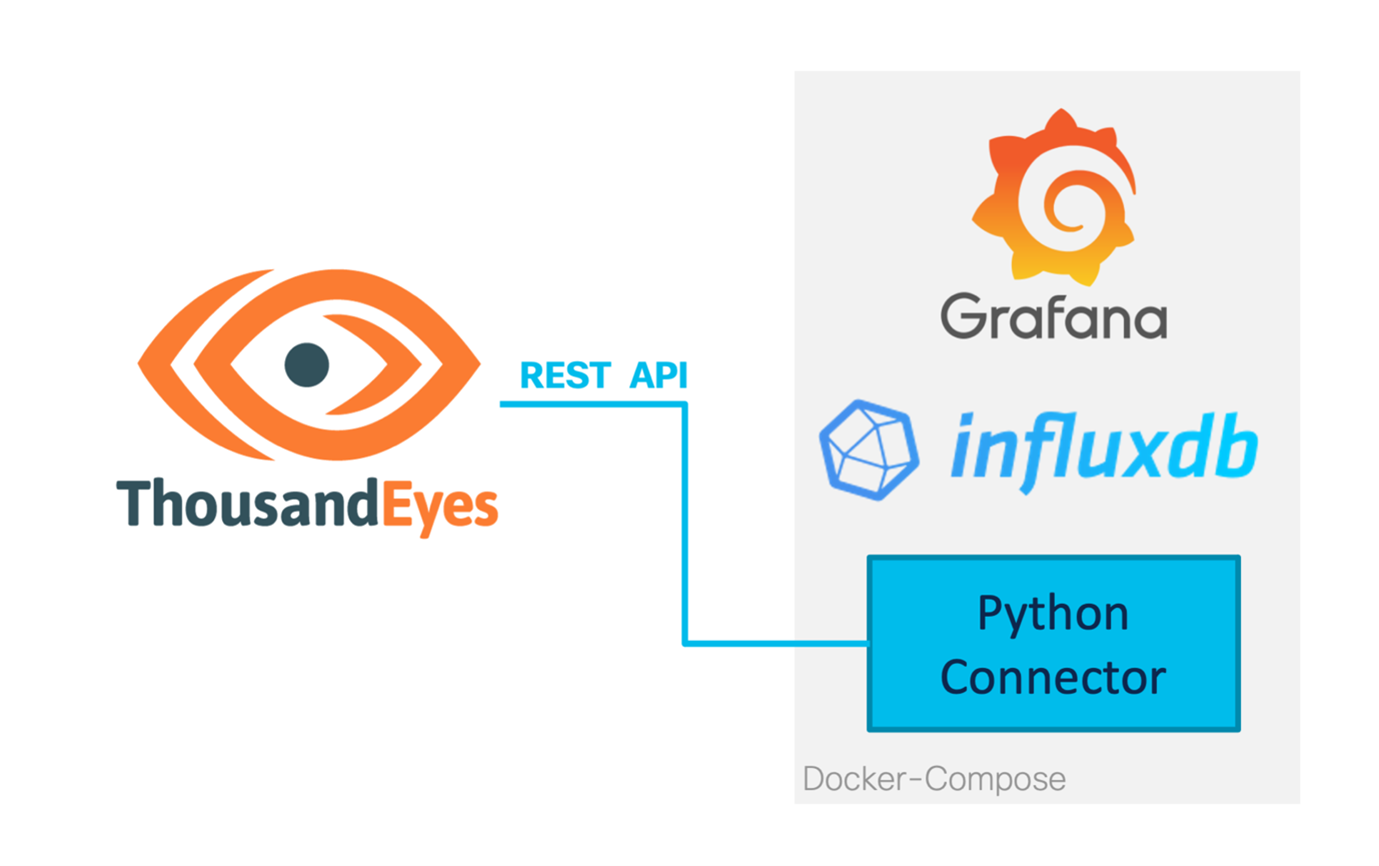
Extracting data from ThousandEyes is easy with the extensive REST API. You can get more information on the developer reference page. With the API you can simply pull the historic or latest data from your ThousandEyes account to any database and visualize it on your dashboard application of choice. As an example, I used a Python script to fetch and insert the data into the time-series database InfluxDB and visualized the data via the analytics & monitoring solution Grafana. To reduce the implementation time for new users, I packaged everything in a multi-container Docker application via Docker-Compose.
The best part is, you can try it out within minutes! Get the code and clone the repository from the DevNet Code Exchange.
Getting historic data and leveraging the Grafana dashboard
The Python connector script allows to fetch even historic data (the user can define the time range) from ThousandEyes which will be then inserted in the database. You can then already see some data in the pre-created Grafana dashboard template which you can edit to your needs. You can see some screenshots below. Furthermore, you can also combine various data sources into the same dashboard (e.g. from WAN routers or firewalls) which can give you the ultimate single view on the health of your assets.

Grafana Dashboard Template Page 1

Grafana Dashboard Template Page 2
Behind the Scenes
I chose to create a Python connector script to have full control of what data should be inserted into InfluxDB and to have the ability to fetch historic data from ThousandEyes. An alternative would be to create a Telegraf plugin in Go to get the latest data.
The data is coming from tests which are configured in the ThousandEyes dashboard. Since every test is collecting different data, and there are various tests, the Python connector scripts only support the most popular test types as of now – (Web) page load, (Web) HTTP server, (Network) end-to-end metrics, (Network) path visualization. The most important information to get the correct data from these tests is the testId which can be queried via the REST API as documented here. Once you have the ID, you can query the data from each of these test types.
I hope you can use this small application to extract data out of ThousandEyes! Of course, feel free to go to DevNet Code Exchange to extend it!
Learn how Cisco’s ThousandEyes provides visibility and helps solve networking problems across the internet. DevNet Snack Minute Episode 35
We’d love to hear what you think. Ask a question or leave a comment below.
And stay connected with Cisco DevNet on social!
LinkedIn | Twitter @CiscoDevNet | Facebook | Developer Video Channel


Great article! Thank you Flo!
where is part 1? can you please reference it?
Sure! It is referenced when you click on “Part 1”: https://blogs.cisco.com/developer/learn1000eyes01
Great article, Thanks! I have a question – How can we extract and integrate ThousandEyes data(performance metrics) into our own stack at platform level(not at device/test/account level) in scalable environment? Do you have any plans to support this?